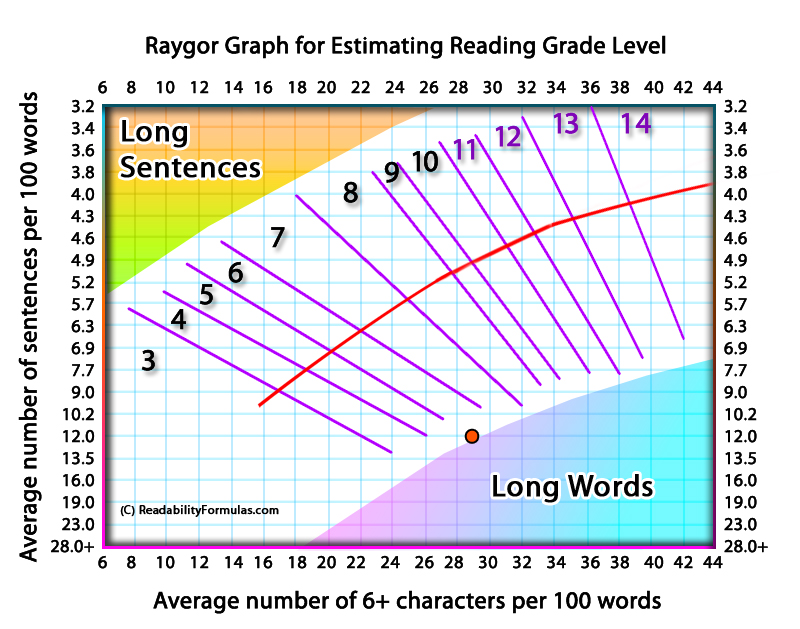
 The Raygor Readability Graph is a formula/graph developed by Alton L. Raygor in the 1970s to assess the reading level of English prose. The graph is a two-dimensional plot, represented on a grid. The x-axis represents the number of words with six or more letters, while the y-axis represents the number of sentences.
The graph is divided into sections, each representing a different grade level (from Grade 1 to Grade 17). The sections are marked by lines, which are drawn based on text analysis and their grade levels. The point at which the lines intersect the axes indicates the grade-level.
Here’s how to use the Raygor Graph:
- Select a Passage: Choose a passage or random sample from the text you want to evaluate. Typically, a 100-word passage is selected.
- Count Sentences: Count the number of sentences in the passage. A sentence is defined as any group of words ending with a period, question mark, or exclamation point.
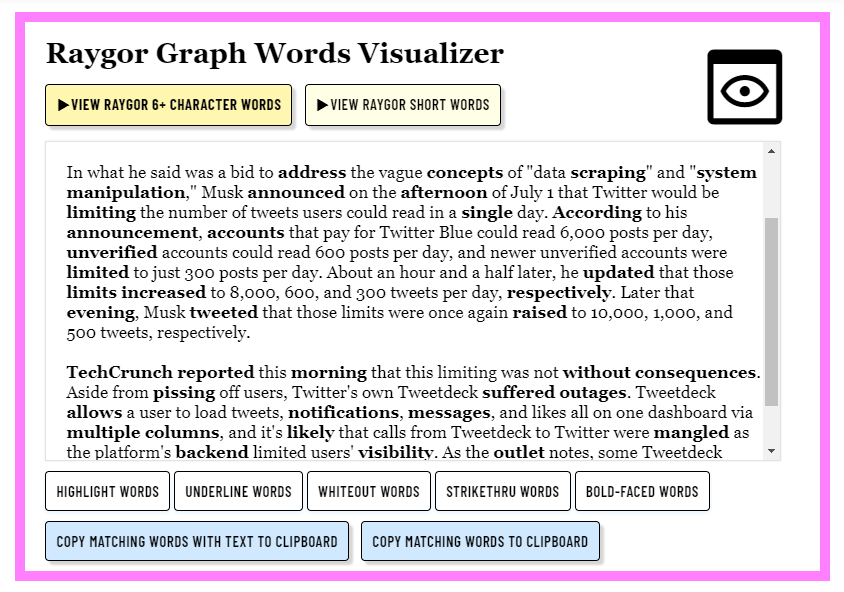
- Count Long Words: Count the number of words in the passage that have six or more letters.
- Plot the Counts: Plot the number of sentences (y-axis) against the number of long words (x-axis). The point at which these two lines intersect on the graph will indicate the approximate grade level of the text.
The grade level corresponds to the U.S. education system, so a grade level of 8 means that the text is suitable for an eighth-grade student or higher. The graph generally ranges from Grade 1 to Grade 17 (which corresponds to postgraduate level).

When you use the Raygor Graph, keep this in mind:
- Sampling: Select the passage to represent the entire text accurately. If the text is long, extract several samples and average them.
- Word Count: The graph emphasizes words with six or more letters, meaning it focuses primarily on vocabulary complexity. This focus can introduce biases; for example, technical texts with many long words may receive higher difficulty ratings, even if they have simple sentence structures.
- Sentence Length: The graph factors in the number of sentences, adding an aspect of syntactic complexity. Shorter sentences are generally easier to read, but that isn’t always true, especially if many short but complex sentences fill the text.
- Limitations: Unlike other readability formulas, the Raygor Readability Estimate fails to consider factors like semantic complexity, cohesion, text layout, or reader interest and motivation, all of which can affect readability.
Raygor Graph vs. the Fry Graph
The Fry Graph and the Raygor Graph are similar tools to estimate text readability visually on a graph, but they differ slightly in calculations.
| Criteria | Fry Graph | Raygor Graph |
|---|---|---|
| Origin | Developed by Dr. Edward Fry in the 1960s. | Developed by Dr. Alton Raygor around the same time. |
| Methodology | Uses average sentences per 100 words and average syllables per 100 words. | Uses average sentences per passage and average syllables per word. |
| Graphical Representation | Plots average number of sentences against average syllables (both per 100 words). | Plots average number of sentences per passage against average syllables per word. |
| Readability Levels | Covers from 1st to 16th grade. | Graph may vary but serves a similar purpose to output a grade level. |
| Sample Size | Typically uses a representative sample, often 100 sentences. | Also uses a representative sample, with the exact number varying. |
Applications
The Raygor Graph is used in various industries, including education, publishing, and healthcare.
Education
- Grade-Level Matching: Helps teachers select texts that align with students’ reading abilities, improving comprehension and engagement. A study by RAND Corporation found that students in schools using aligned texts scored 3.72 points higher on average in standardized testing (Steiner, 2017).
- Curriculum Development: Used by educational publishers to design textbooks and materials that meet grade-level standards.
- Literacy Programs: Assists in tailoring reading interventions for students who may be struggling, targeting materials at an appropriate level for incremental growth. According to the National Center for Education Statistics, 21% of adults in the U.S. read below the fifth-grade level.
Publishing Industry
- Target Audience Alignment: Enables publishers to match the reading level of magazines, newspapers, and books to the intended audience, ensuring accessibility. The New York Times has a readability score of about 8th grade, matching its diverse readership.
- Content Optimization: Authors and editors use the Raygor Graph to assess drafts and make adjustments, aligning with the reading preferences of their market segment.
- Marketing Decisions: Helps in determining the suitable market for a text, such as distinguishing between young adult, adult fiction, or specialized technical audiences.
Healthcare
- Patient Education Materials: Used in crafting pamphlets, brochures, and instructions that patients can easily understand, which contributes to better adherence to medical advice. A study published in JAMA found a 19% increase in medication adherence with well-tailored patient materials.
- Provider-Patient Communication: Assists healthcare providers in tailoring their verbal communication to the literacy level of the patient, improving understanding and compliance. “Clear communication builds trust and understanding between patients and providers“—Institute for Healthcare Improvement.
- Health Literacy Assessment: Used in larger-scale assessments of health literacy within communities, helping shape public health campaigns and interventions. Only 12% of U.S. adults have proficient health literacy, according to the U.S. Department of Health and Human Services.
Government and Legal Fields
- Legal Documents: Helps in designing legal forms and information that are more accessible to the general public, reducing confusion.
- Government Communications: Assists in crafting government publications, websites, and public notices that are understandable to a broad audience, enhancing civic engagement. The Plain Writing Act of 2010 in the U.S. mandated clear communication to the public.
Business and Marketing
- Product Manuals: Facilitates the creation of user-friendly product guides and manuals, enhancing customer satisfaction. According to a survey by PTC, 45% of customers have returned a product due to confusion with the manual.
- Advertising Content: Used in shaping advertising and marketing materials that resonate with the intended consumer base, potentially increasing conversion rates. A study by CMO Council found that relevance and simplicity in advertising can increase engagement by up to 30%.
The Raygor Graph has diverse applications across various fields, from education to healthcare to business. It serves as a valuable tool for making texts more accessible and engaging to specific audiences.
You can use ReadabilityFormulas.com’s free Raygor Graph Calculator to analyze your text and automatically plot the results on the graph.


